This blog is the represenation of the labs I completed Spring 2011 for my Methods of Field Ecology Course. I would like to say thank you to Professor Gilchrist who always provided an interesting, humorous, and stimulating lecture. Thanks for the great semester.
Sincerely,
Aidan
Tuesday, May 17, 2011
Bird Diversity at the Shore
Group Members: Myself, Krystaal, Lauren, Kelsey (I won't post their last names for internet safety reasons)
Hypothesis: As the number of people present at the beach increases, we will see fewer bird species at the beach.
Where did we sample: North and South Lido Beach. We chose two separate beaches because one is a preserve park (South Lido) and further away from the hustle and bustle of the tourist-centric St. Armands Circle. While North Lido is only about a hundred meters away from St. Armands Circle.
When: we sampled around 3:00 Wednesday, Thursday, Saturday, and Sunday. We sampled each site twice a week. Each beach was sampled once during the week and once on the weekends. We did this to compensate for weekend crowds at the beach.
Assumptions: we assumed that people would not be as prevalent on the beaches during the week, thus giving us a good comparison.
How our data may have been skewed: Apart from plain mathematical human error it is possible that we could have miscounted the people on the beach or misidentified species since some of the gull species look remarkably similar when juvenile, first winter, or a different color morph.
Below you can find a GIS map of the species we found at North Lido and South Lido as well as a table representing the different weather conditions.


Our results proved insignificant because we did not have enough data. There was also an important outlier. The weekend of easter both beaches were packed. Though we did not have enough data to be significant, anectodally it was very clear that the fewer people on the beach the more species diversity in birds was apparent. Normally we saw more people at North Lido than at South Lido.
Species Observed: Laughing Gull (the most common species, appearing at every observation), Herring Gull (2nd most common), Ring Billed Gull (3rd most common), Sanderling (also 3rd most common), Willet, Double Crested Cormorant, Vulture (Turkey), Crow (unidentified between Fish Crow and American Crow), Brown Pelican (all seen in mating plumage), Least Tern, Royal Tern, Sandwich Tern, Common Tern, Great Blue Heron (regularly seen at South Lido where we believe at least one heron to be roosting), Snowy Egret, White Ibis, American Golden Plover (female only), Black Skimmer, and Mockingbird.
Misidentification: The species likely misidentified were female American Golden Plover vs Sanderling and Laughing Gull, Herring Gull, and Ring Billed Gull juveniles.
The highlight of the experiment: Observing at South Lido and seeing a large group of Black Skimmers, Sandwich Terns, Royal Terns, Least Terns, and Common Terns all making a ruckus. Below is a picture of a flock of Black Skimmers.

Microbial Communities on a Salt Concentration Gradient 9C
I completed this lab with the help of the lovely Krystaal. Below you can see our data table.

1. Our experiment compares with Whitaker's study of trees in the Great Smokey Mountains because we both measured at regular intervals along a gradient.
2. Clements would predict no overlap between gradients. Gleason would predict overlap.
3. The model that best represents our data is the Gleason model because the same species was found in different infusions.
4. I definitely expect different results, but not drastically different results. The spring water used would still have salt in it from being salty in the first place.
5. I did not sniff the samples, though by the end many of them looked the same. Some samples because more mucus-like in consistency with what I can only describe as "goop" growing in them. I would expect different types of bacteria to grow in different salt concentrations. I know this from personal experience since I lent Krystaal salt to make salt water to clean her new piercings.
Niches of Birds at a Feeding Station 8B
Though Professor Gilchrist saw mockingbirds and white ibis at the feeding station, my multiple attempts early in the day, afternoon, and sunset did not reveal any birds using the feeder. Only squirrels. However, bird beaks often dictate what the bird eats (or what the bird eats, long ago determined the beak type). I have included a two handy charts for bill-type and feeding niche.


GIS: Project and Thoughts
Special thanks to the wonderful Dr. Jennifer Shafer who taught me GIS.
Project: GIS (Geographic Information System) is a new way to effectively analyize spatial data. During January 2011 we used GIS to map part of the coast of Sarasota Bay. We looked specifically for types of shorelines, docks and jetties, and outflows that might inhibit restoration along the shore line. We then made maps to present our analysis of the data we collected. Unfortunately, I cannot upload TIFF files or PDFs to my blog so I cannot show off my fabulous maps.
Thoughts: GIS is literally applicable to everything as long as sufficient data is gathered and digitized properly. It is an invaluable tool that I would like to see used more often and encouraged at New College. However, I should point out that ArcGIS is one of the most complicated interfaces I've ever worked with. I do not think I have ever worked with a less intiutive program. It is impossible for GIS to become a less complicated kind of program, however if one needs a degree in GIS to fully understand everything that it is capable of then the software is not useful to most people in the world. I believe that GIS is applicable to every field, however until its design is simplified it will not take off as useful for most people. Though it is worth noting that despite its complexity some people, like myself, use it anyways.
GIS is proving to be particularly helpful in the environmental field. One project in particular, the Natura 2000 project aims "to raising awareness of Natura 2000 the Europe-wide network of sites tasked with the preservation of your natural heritage." Below is the site for further information.
Natura 2000
Comparing Exponential and Logistic Growth 4B
This experiment looks at the population growth of African Elephants (Loxodonta africana) in Addo National Park in South Africa over the span of 23 years. Below you will find a graph of my table (at the top Observed Numb is meant to say Observed Number, but I cut it too close on accident) and my graphs done in Excel. Special thanks to the wonderful Dr. Jennifer Shafer who taught me how to effectively use Excel graphs and taught me the importance of color choice for graphs.


1. Darwin was only mildly conservative in his population estimates. The population did triple but at a slower growth rate.
2. As a park manager I would like to institute some sort of controlled breeding since the Addo Elephants may someday reach their carrying capacity. This can be a problem since a park has limited space and resources. What I would like to do is encourage a genetic study of the Addo elephants so that I, as a park manager, can keep track of who is breeding and their genetics, this way I can manage breedings for the most genetic biodiversity and still have a breeding population of elephants. If the population got too out of control I would not encourage culling the population nor would I encourage a chemical birth control method. I think a better means of population control, that still encourages genetic diversity, would be translocating some elephants into different parks that have limited genetic diversity.
3. To determine a more realistic value for K I would first look at the amount of resources (food, space, and water) available in the park. Then I would consider how much of each resource does one elephant need. This would give me a better idea of the carrying capacity of elephants in my park.
4. Some of the factors that have been limiting population growth in humans since 1978 are medicine, environmentalism, and agriculture. Effective means of birth control, longer life spans due to medicine (less adult death and less infant death), and advanced medicine for diseases that are harmful to people have altered "r" and increased "K". Environmentalism also plays a big role. I believe many people have noticed the rapid population growth of the human race and are abstaining from making their own offspring and instead adopting, or abstaining from children all together. I also believe that religion has always had an effect on the population, until recently when the Pope condoned the use of contraceptives. Finally, the recent ability for huge large scale farms increase the availability of food, with the increase of food comes an increase in population. I believe that we have only postponed Malthus' fears.
5. I have no clue what the global carrying capacity is for the human race. I believe at the rate we are reproducing we will not have enough resources to sustain ourselves and keep the planet healthy. I try to do my part in limiting my resources as much as possible. I also believe the human race will colonize the moon before our resources run out.

Calculating r From A Published Data Set 4A
First of all if you have never seen an Egyptian Goose here is what they look like:
 Photo Courtesy of: Sonja Vinck
Below you will find the table of my data and graph representative of that data. Krystaal helped me out with the graph since I do not have graph paper nor do I have the ToolPak for Excel (though Excel really should come with all the necessary tools, but I digress).


1. The exponential growth equation is Nt =N0(e^rt) (I can't get the formatting right). Nt is the population at the time of observation (variable). N0 is the initial population (constant). e is a mathematical constant (2.718). r is the rate of growth of a population (constant). t is time (variable).
2. In 1994 the population estimate for the Egyptian goose was 7,666 (which is higher than the number of geese actually observed). I believe that this may be due to predation (an increase in prey = an increase in opportunity for predation) or it may just be human error.
3. The method we used for calculating "r" is more reliable because points on the graph may not fall on the line of best fit. Choosing only two points on the data table would mean holes in your analysis.
4. A brief word on Egyptian Geese. Originally from Africa, there are many feral populations in Europe in places like the Netherlands. Their increase in population in Europe may be because it is up to meso-predators (raccoons, foxes, possums, etc) to limit the population. It is likely that there are fewer predators in Netherlands that prey upon the Egyptian Goose. To equate the feral Egyptian Goose to a similar invasive waterfowl, imagine the population of Muscovy Ducks in Florida.
5. Another famous exotic invasive bird species is the European Starling (Sturnus vulgaris). In 1890 a man by the name of Eugene Schieffelin (president of the American Acclimatization Society at the time) decided to release every bird species named in all of Shakespeare's works into Central Park, New York. There are roughly 200 million European Starlings in America all descended from the 60-100 birds that Eugene let loose in New York. This event is considered an environmental disaster (because "STARLING-OCALYPSE" is too hard to say). This highly invasive bird edges out native species and destroys crops. They also travel in huge flocks which pose a threat to air travel. Their droppings are highly corrosive and cause millions of dollars worth of damage to buildings every year. Irony of ironies, the European Starling is now considered rare, vulnerable, with populations declining in it's native European habitat (including England). Below is a picture of an adult European Starling.


Below you will find the table of my data and graph representative of that data. Krystaal helped me out with the graph since I do not have graph paper nor do I have the ToolPak for Excel (though Excel really should come with all the necessary tools, but I digress).

1. The exponential growth equation is Nt =N0(e^rt) (I can't get the formatting right). Nt is the population at the time of observation (variable). N0 is the initial population (constant). e is a mathematical constant (2.718). r is the rate of growth of a population (constant). t is time (variable).
2. In 1994 the population estimate for the Egyptian goose was 7,666 (which is higher than the number of geese actually observed). I believe that this may be due to predation (an increase in prey = an increase in opportunity for predation) or it may just be human error.
3. The method we used for calculating "r" is more reliable because points on the graph may not fall on the line of best fit. Choosing only two points on the data table would mean holes in your analysis.
4. A brief word on Egyptian Geese. Originally from Africa, there are many feral populations in Europe in places like the Netherlands. Their increase in population in Europe may be because it is up to meso-predators (raccoons, foxes, possums, etc) to limit the population. It is likely that there are fewer predators in Netherlands that prey upon the Egyptian Goose. To equate the feral Egyptian Goose to a similar invasive waterfowl, imagine the population of Muscovy Ducks in Florida.
5. Another famous exotic invasive bird species is the European Starling (Sturnus vulgaris). In 1890 a man by the name of Eugene Schieffelin (president of the American Acclimatization Society at the time) decided to release every bird species named in all of Shakespeare's works into Central Park, New York. There are roughly 200 million European Starlings in America all descended from the 60-100 birds that Eugene let loose in New York. This event is considered an environmental disaster (because "STARLING-OCALYPSE" is too hard to say). This highly invasive bird edges out native species and destroys crops. They also travel in huge flocks which pose a threat to air travel. Their droppings are highly corrosive and cause millions of dollars worth of damage to buildings every year. Irony of ironies, the European Starling is now considered rare, vulnerable, with populations declining in it's native European habitat (including England). Below is a picture of an adult European Starling.

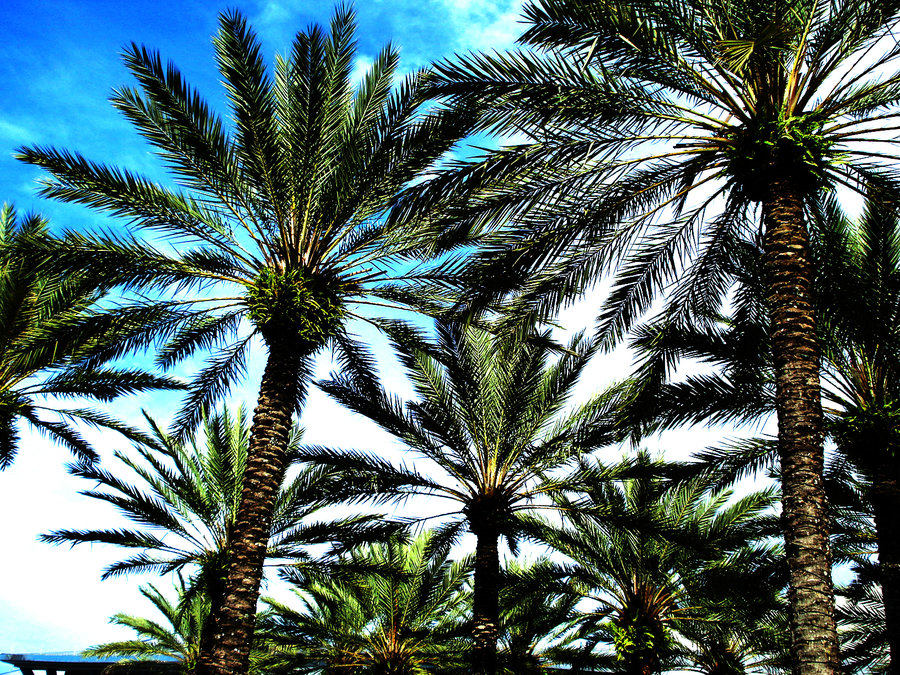
The Size and Shape of Trees 2C
I worked on this lab with the lovely Krystaal and we went out and measured the circumference, trunk diameter, angle of inclination, length of basseline, and distance to baseline, which once all calculated together gave us the tree height of the measured individual. The lab instructed us to pick a taxa so we picked Palms which are prevalent on campus in a variety of shapes and sizes.


 Above are our representations of our data (table and graph).
1. As our graph shows there is a linear correlation between the diameter of the trunk and the height of the tree. Though one can see that some points are very far from the line of best fit. This may be because of the wide variety of palms found on campus. We measured the very tall Royal Palms in Palm Court (which may be our outliers) as well as the shorter palms which we expect to be Bismarck Palms (though we don't really know neither one of us are Palm taxa experts). In retrospect it would've been useful to study up on the palms found on campus before going out as well as taking note of the species we sample so that we would be able to identify our outliers.
2. I see a trend in our palm trees similar to the proportions for legs of heavy animals (as seen in Figure 2.6 of Elements of Ecology by Smith and Smith 7th ed.). However, I did not see this trend in all our palm samples probably because we measure a variety of palms.
3. To determine the volume of the tree trunk one would take the radius squared, multiplied by the height. The cross sectional area can be calculated by squaring the radius and multiplying it by pi.
4. The definition of tangent is "the ratio of the opposite to the adjacent side of a right angle triangle"*. This was used because we did not know the height of the trees (what we were trying to find out) for sine and cosine it is imperative to already know the height of the tree. If we already knew the height of the tree we wouldn't need to do any calculations.
5. Living in Florida I expect most of our palm trees to be effected by our extreme weather, in particular hurricanes. Krystaal pointed out the curvy-ness of the palms which would also be indicative of high winds from storms. I also expect that, at least for the palms in Palm court, living in a small square must effect your growth at some point. This could effect our results since our trees were not straight, thus putting their height above their actual height.
*Definition From Princeton Word Reference
Estimating Ecological Efficiency of Leaf Miners 17C
Firstly, a leaf miner is a small insect that lives inside leaves until ready to hatch out. It is likely that most people have not seen a leaf miner, this is what they look like.
 However, you may have seen the effect they leave of leaves...

We collected several samples from oak leaves and below you can see our table. (If you click on it, it gets bigger)

1. If I relate the relationship between leaf miners and leaves to ecological efficiency and the table 17.3 found in Elements of Ecology by Smith and Smith (7th ed.) then clearly the leaves would be the producers and the leaf miners would be the primary consumers.
2. To measure efficiency based on kcal energy in the insect versus the kcal energy of the leaf tissue it ate you would need to determine the amount of energy it takes for a leaf miner to devour its leaf. It is also important to know the amount of kcals in the area of that leaf.
3. In comparison between an adult leaf-eating beetle and the leaf miners I would expect the efficiency of the leaf miner to be higher since it always has access to a food source and does not need to worry about evading predators since when it lives in the leaf it has few predators. The leaf miners simply need to chew their way through their own food source.
4. The second law of thermodynamics states that "a transfer of heat from one body to another proceeds naturally and continuously from the warmer to the cooler body"*. That being said I do not know how this relates to the ecological efficiency of the leaf miners. The first law of thermodynamics states that "energy is neither created nor destroyed in the conversion of heat to or from other forms of energy"*, which I can easily see applied to the leaf miner scenario. The leaf miners must expend energy to tunnel through the leaf, it takes energy to consume food and turn it into energy.
5. I think it is possible for a leaf miner to be considered both a parasite and a herbivore. However, it is important to distinguish that it should be considered an endoparasite and not just a plain parasite. An endoparasite lives inside the host (leaf miners are laid in the leaves).
* How Stuff Works
Dissolved Oxygen and Temperature 16A
This lab was concerned with finding the dissolved oxygen and temperature of different water samples from different places (or similar samples but different temperatures). I worked with this Lab with the lovely Krystaal. Below is the table of our data, and two tables reflecting the data. Temperature is in Celsius.


3. We collected samples from all over Sarasota, from the outside showers at South Lido to toilet bowl water at New College. However, of all the samples shown on our field samples curve (which does not compare with our other samples curve). This may have been because some samples were salt water which may allow for more or less oxygen. The only samples that seemed to have oxygen satutration were Sarasota Bay (collected from our own bay front) and Krystaal's toilet bowl water (which she is a champ for collecting).
4. The relationship between temperature and dissolved oxygen is important to the symbiotic algae with in the bodies of coral polyps on tropical reefs. The warm water that tropical reefs live in has lots of dissolved oxygen which encourage algae growth. The more dissolved oxygen the better for coral polyps which in turn provide algae with carbon dioxide (symbiotic relationship). The algae processes the carbon dioxide in the water which then increases the amount of dissolved oxygen in the water.
5. Climate change can be devastating to the tropical reefs of the world, by raising the temperature of the water the amount of dissolved oxygen would also increase. It is important to know that tropical reefs, though stunning and some ancient, are very fragile. Even a slight change in temperature, for example the entire world's temperature increases by one or two degrees, can greatly effect corals (and everything else on the planet as well). Everything is interconnected, a raise in temperature means the continued melting of the polar ice caps which could mean deeper water, which could effect how much sunlight tropical reefs get (especially those that are already existing as deep as possible).

Photo courtesy of: Andy Serrano
1. Firstly, it is important to note that there may be significant human error which may have altered our results (the dissolved oxygen meter was finicky and we may not have set it up right). That being said: For our experiment we used tap water instead of spring water. This could be the reason our results are curvilinear. However, it is important to note that the hotter the water, the faster the water molecules are moving thus allowing for more oxygen to diffuse through the water.
2. If oxygen is dissolved in cold water which is then warmed the oxygen expands. I've observed this phenomenon on the Magic School Bus "Molecule" episode and when boiling water.
3. We collected samples from all over Sarasota, from the outside showers at South Lido to toilet bowl water at New College. However, of all the samples shown on our field samples curve (which does not compare with our other samples curve). This may have been because some samples were salt water which may allow for more or less oxygen. The only samples that seemed to have oxygen satutration were Sarasota Bay (collected from our own bay front) and Krystaal's toilet bowl water (which she is a champ for collecting).
4. The relationship between temperature and dissolved oxygen is important to the symbiotic algae with in the bodies of coral polyps on tropical reefs. The warm water that tropical reefs live in has lots of dissolved oxygen which encourage algae growth. The more dissolved oxygen the better for coral polyps which in turn provide algae with carbon dioxide (symbiotic relationship). The algae processes the carbon dioxide in the water which then increases the amount of dissolved oxygen in the water.
5. Climate change can be devastating to the tropical reefs of the world, by raising the temperature of the water the amount of dissolved oxygen would also increase. It is important to know that tropical reefs, though stunning and some ancient, are very fragile. Even a slight change in temperature, for example the entire world's temperature increases by one or two degrees, can greatly effect corals (and everything else on the planet as well). Everything is interconnected, a raise in temperature means the continued melting of the polar ice caps which could mean deeper water, which could effect how much sunlight tropical reefs get (especially those that are already existing as deep as possible).

Photo courtesy of: Andy Serrano
Saturday, May 14, 2011
Needle Length in Conifers 1B
This is experiment 1B from Ecology On Campus by Robert W. Kingsolver.
I worked on this experiment with the help of Lauren and Krystaal my stalwart ecology experiment partners. Attached you will see the Summary of Results and the Histogram (lovingly drawn by Krystaal). We looked at Red Pine (Pinus resinosa) needle length variation among individual trees.


1. As evident by our histogram, our data does not fit into a bell curve. I would have to say that more than anything our histogram is skewed with brief moments of flattened and sharply peaked. If I were to perform statistical tests using this data I would seek a non-parametic alternative since the data is not evenly distributed (roughly 75% on one side of the peak). Though I do not feel I made enough measurements to make a certain judgment on this question. If I had more time I would have liked to collect more data.
2. The sample mean of my data was 23.6 cm. The sample median of my data was 23.8 cm. The sample mode of my data was 26 cm. I believe that it would be acceptable to use either median or mean, since both measurements are very close to one another. However, the same cannot be said for using the mode. This relates to question one since the data does not fall under the bell curve and is instead more skewed.
3. The mean is another word for "average" taking the mean of all the pine needles lengths would simply give you the average length of all the pine needles you sampled. Standard deviation, on the other hand, describes the ranges of needle length.
4. To do this experiment I would collect the leaves of one kind of tree, preferably a tree not surrounded by any other trees of the same species and see if there is a correlation between number of seeds produced. I would assume that broader (or more numerous) leaves belong to trees that produce more seeds. However, it is important to realize that many seeds may be carried off my granivores. I would then collect the seeds and head off to part two of my experiment, to see if seed production is an inherited trait. I would encourage community participation and planning and planting the new trees around the community. When ready to reproduce I would compare new seed data with the seed data of the parent tree. This would be a great way to help the environment, get the community involved in ecology, and an opportunity to teach kids about the environment and native trees.

Further interesting reading (though not red pine) Inheritance of Needle and Bud Characteristics of Slash Pine
I worked on this experiment with the help of Lauren and Krystaal my stalwart ecology experiment partners. Attached you will see the Summary of Results and the Histogram (lovingly drawn by Krystaal). We looked at Red Pine (Pinus resinosa) needle length variation among individual trees.

1. As evident by our histogram, our data does not fit into a bell curve. I would have to say that more than anything our histogram is skewed with brief moments of flattened and sharply peaked. If I were to perform statistical tests using this data I would seek a non-parametic alternative since the data is not evenly distributed (roughly 75% on one side of the peak). Though I do not feel I made enough measurements to make a certain judgment on this question. If I had more time I would have liked to collect more data.
2. The sample mean of my data was 23.6 cm. The sample median of my data was 23.8 cm. The sample mode of my data was 26 cm. I believe that it would be acceptable to use either median or mean, since both measurements are very close to one another. However, the same cannot be said for using the mode. This relates to question one since the data does not fall under the bell curve and is instead more skewed.
3. The mean is another word for "average" taking the mean of all the pine needles lengths would simply give you the average length of all the pine needles you sampled. Standard deviation, on the other hand, describes the ranges of needle length.
4. To do this experiment I would collect the leaves of one kind of tree, preferably a tree not surrounded by any other trees of the same species and see if there is a correlation between number of seeds produced. I would assume that broader (or more numerous) leaves belong to trees that produce more seeds. However, it is important to realize that many seeds may be carried off my granivores. I would then collect the seeds and head off to part two of my experiment, to see if seed production is an inherited trait. I would encourage community participation and planning and planting the new trees around the community. When ready to reproduce I would compare new seed data with the seed data of the parent tree. This would be a great way to help the environment, get the community involved in ecology, and an opportunity to teach kids about the environment and native trees.

Further interesting reading (though not red pine) Inheritance of Needle and Bud Characteristics of Slash Pine
Pennies in a boat
This is a simple experiment that poses the question, which boat formation can hold the most weight? Using one sheet of paper design a boat that could support the weight of as many pennies as possible, you can fold the paper any way you like, but it can only be one sheet of paper.
We looked at this experiment partnered with a lecture on surface tension.
I partnered up with fellow ecology enthusiasts Krystaal and Lauren to build a magnificent boat on which to float as many pennies as we could possibly fit. We succeeded with almost 200 pennies and a rectangle shaped boat.
It was like this...but with pennies instead.
 Photo courtesy of: Zachary Tumlin
We looked at this experiment partnered with a lecture on surface tension.
I partnered up with fellow ecology enthusiasts Krystaal and Lauren to build a magnificent boat on which to float as many pennies as we could possibly fit. We succeeded with almost 200 pennies and a rectangle shaped boat.
It was like this...but with pennies instead.

About this Blog
This blog has been prepared for the Spring 2011 class Methods of Field Ecology taught by Professor Gilchrist at New College of Florida using the Ecology on Campus Lab Manual by Robert W. Kingsolver.
Subscribe to:
Comments (Atom)