Tuesday, May 17, 2011

The Size and Shape of Trees 2C

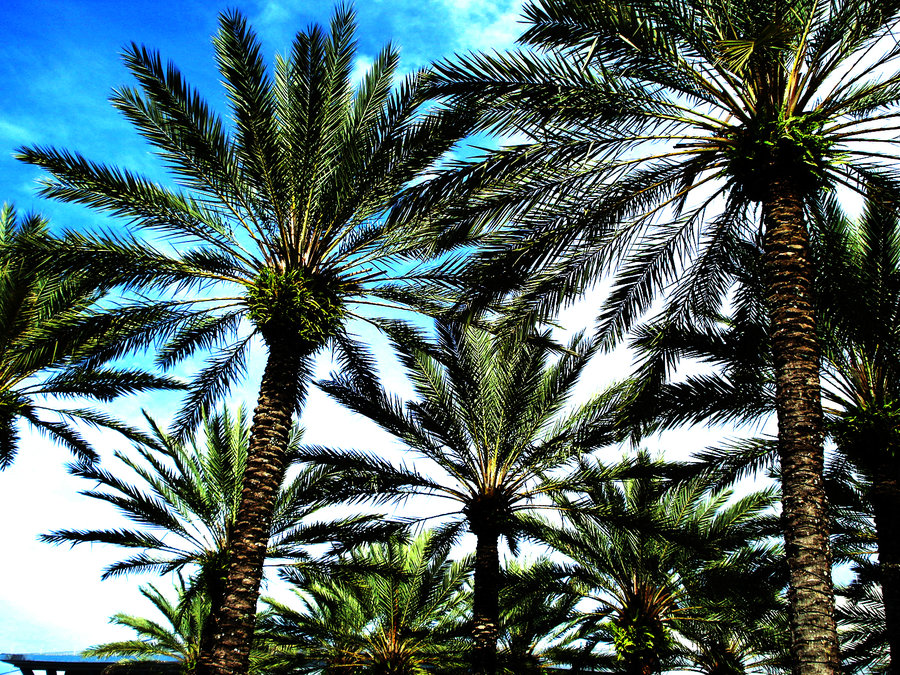
I worked on this lab with the lovely Krystaal and we went out and measured the circumference, trunk diameter, angle of inclination, length of basseline, and distance to baseline, which once all calculated together gave us the tree height of the measured individual. The lab instructed us to pick a taxa so we picked Palms which are prevalent on campus in a variety of shapes and sizes.


Above are our representations of our data (table and graph).

1. As our graph shows there is a linear correlation between the diameter of the trunk and the height of the tree. Though one can see that some points are very far from the line of best fit. This may be because of the wide variety of palms found on campus. We measured the very tall Royal Palms in Palm Court (which may be our outliers) as well as the shorter palms which we expect to be Bismarck Palms (though we don't really know neither one of us are Palm taxa experts). In retrospect it would've been useful to study up on the palms found on campus before going out as well as taking note of the species we sample so that we would be able to identify our outliers.

2. I see a trend in our palm trees similar to the proportions for legs of heavy animals (as seen in Figure 2.6 of Elements of Ecology by Smith and Smith 7th ed.). However, I did not see this trend in all our palm samples probably because we measure a variety of palms.

3. To determine the volume of the tree trunk one would take the radius squared, multiplied by the height. The cross sectional area can be calculated by squaring the radius and multiplying it by pi.

4. The definition of tangent is "the ratio of the opposite to the adjacent side of a right angle triangle"*. This was used because we did not know the height of the trees (what we were trying to find out) for sine and cosine it is imperative to already know the height of the tree. If we already knew the height of the tree we wouldn't need to do any calculations.

5. Living in Florida I expect most of our palm trees to be effected by our extreme weather, in particular hurricanes. Krystaal pointed out the curvy-ness of the palms which would also be indicative of high winds from storms. I also expect that, at least for the palms in Palm court, living in a small square must effect your growth at some point. This could effect our results since our trees were not straight, thus putting their height above their actual height.


*Definition From Princeton Word Reference

Estimating Ecological Efficiency of Leaf Miners 17C

Firstly, a leaf miner is a small insect that lives inside leaves until ready to hatch out. It is likely that most people have not seen a leaf miner, this is what they look like.
However, you may have seen the effect they leave of leaves...


We collected several samples from oak leaves and below you can see our table. (If you click on it, it gets bigger)


1. If I relate the relationship between leaf miners and leaves to ecological efficiency and the table 17.3 found in Elements of Ecology by Smith and Smith (7th ed.) then clearly the leaves would be the producers and the leaf miners would be the primary consumers.

2. To measure efficiency based on kcal energy in the insect versus the kcal energy of the leaf tissue it ate you would need to determine the amount of energy it takes for a leaf miner to devour its leaf. It is also important to know the amount of kcals in the area of that leaf.

3. In comparison between an adult leaf-eating beetle and the leaf miners I would expect the efficiency of the leaf miner to be higher since it always has access to a food source and does not need to worry about evading predators since when it lives in the leaf it has few predators. The leaf miners simply need to chew their way through their own food source.

4. The second law of thermodynamics states that "a transfer of heat from one body to another proceeds naturally and continuously from the warmer to the cooler body"*. That being said I do not know how this relates to the ecological efficiency of the leaf miners. The first law of thermodynamics states that "energy is neither created nor destroyed in the conversion of heat to or from other forms of energy"*, which I can easily see applied to the leaf miner scenario. The leaf miners must expend energy to tunnel through the leaf, it takes energy to consume food and turn it into energy.

5. I think it is possible for a leaf miner to be considered both a parasite and a herbivore. However, it is important to distinguish that it should be considered an endoparasite and not just a plain parasite. An endoparasite lives inside the host (leaf miners are laid in the leaves).

* How Stuff Works

Dissolved Oxygen and Temperature 16A

This lab was concerned with finding the dissolved oxygen and temperature of different water samples from different places (or similar samples but different temperatures). I worked with this Lab with the lovely Krystaal. Below is the table of our data, and two tables reflecting the data. Temperature is in Celsius.


1.  Firstly, it is important to note that there may be significant human error which may have altered our results (the dissolved oxygen meter was finicky and we may not have set it up right). That being said: For our experiment we used tap water instead of spring water. This could be the reason our results are curvilinear. However, it is important to note that the hotter the water, the faster the water molecules are moving thus allowing for more oxygen to diffuse through the water.

2. If oxygen is dissolved in cold water which is then warmed the oxygen expands. I've observed this phenomenon on the Magic School Bus "Molecule" episode and when boiling water.


3. We collected samples from all over Sarasota, from the outside showers at South Lido to toilet bowl water at New College. However, of all the samples shown on our field samples curve (which does not compare with our other samples curve). This may have been because some samples were salt water which may allow for more or less oxygen. The only samples that seemed to have oxygen satutration were Sarasota Bay (collected from our own bay front) and Krystaal's toilet bowl water (which she is a champ for collecting).

4. The relationship between temperature and dissolved oxygen is important to the symbiotic algae with in the bodies of coral polyps on tropical reefs. The warm water that tropical reefs live in has lots of dissolved oxygen which encourage algae growth. The more dissolved oxygen the better for coral polyps which in turn provide algae with carbon dioxide (symbiotic relationship). The algae processes the carbon dioxide in the water which then increases the amount of dissolved oxygen in the water.

5. Climate change can be devastating to the tropical reefs of the world, by raising the temperature of the water the amount of dissolved oxygen would also increase. It is important to know that tropical reefs, though stunning and some ancient, are very fragile. Even a slight change in temperature, for example the entire world's temperature increases by one or two degrees, can greatly effect corals (and everything else on the planet as well). Everything is interconnected, a raise in temperature means the continued melting of the polar ice caps which could mean deeper water, which could effect how much sunlight tropical reefs get (especially those that are already existing as deep as possible).


Photo courtesy of: Andy Serrano

Saturday, May 14, 2011

Needle Length in Conifers 1B

This is experiment 1B from Ecology On Campus by Robert W. Kingsolver.
I worked on this experiment with the help of Lauren and Krystaal my stalwart ecology experiment partners. Attached you will see the Summary of Results and the Histogram (lovingly drawn by Krystaal). We looked at Red Pine (Pinus resinosa) needle length variation among individual trees.


1. As evident by our histogram, our data does not fit into a bell curve. I would have to say that more than anything our histogram is skewed with brief moments of flattened and sharply peaked. If I were to perform statistical tests using this data I would seek a non-parametic alternative since the data is not evenly distributed (roughly 75% on one side of the peak).  Though I do not feel I made enough measurements to make a certain judgment on this question. If I had more time I would have liked to collect more data.

2. The sample mean of my data was 23.6 cm. The sample median of my data was 23.8 cm. The sample mode of my data was 26 cm. I believe that it would be acceptable to use either median or mean, since both measurements are very close to one another. However, the same cannot be said for using the mode. This relates to question one since the data does not fall under the bell curve and is instead more skewed.

3. The mean is another word for "average" taking the mean of all the pine needles lengths would simply give you the average length of all the pine needles you sampled. Standard deviation, on the other hand, describes the ranges of needle length.

4. To do this experiment I would collect the leaves of one kind of tree, preferably a tree not surrounded by any other trees of the same species and see if there is a correlation between number of seeds produced. I would assume that broader (or more numerous) leaves belong to trees that produce more seeds. However, it is important to realize that many seeds may be carried off my granivores. I would then collect the seeds and head off to part two of my experiment, to see if seed production is an inherited trait. I would encourage community participation and planning and planting the new trees around the community. When ready to reproduce I would compare new seed data with the seed data of the parent tree. This would be a great way to help the environment, get the community involved in ecology, and an opportunity to teach kids about the environment and native trees.


Further interesting reading (though not red pine) Inheritance of Needle and Bud Characteristics of Slash Pine

Pennies in a boat

This is a simple experiment that poses the question, which boat formation can hold the most weight? Using one sheet of paper design a boat that could support the weight of as many pennies as possible, you can fold the paper any way you like, but it can only be one sheet of paper.

We looked at this experiment partnered with a lecture on surface tension.

I partnered up with fellow ecology enthusiasts Krystaal and Lauren to build a magnificent boat on which to float as many pennies as we could possibly fit. We succeeded with almost 200 pennies and a rectangle shaped boat.

It was like this...but with pennies instead.
 Photo courtesy of: Zachary Tumlin

About this Blog

This blog has been prepared for the Spring 2011 class Methods of Field Ecology taught by Professor Gilchrist at New College of Florida using the Ecology on Campus Lab Manual by Robert W. Kingsolver.